
To assist fiduciaries in answering the important question of “How are we doing?” this paper will address:
- How fiduciaries should use benchmarks
- Common types of benchmarks used for evaluation
- Constructing benchmarks at the total portfolio level
What are benchmarks and how should fiduciaries use them?
A benchmark is a measurement tool that provides a reference point for determining the success of an investment strategy and to confirm achievement of a goal. We’ll explore three types of benchmarks that can be useful at both the individual manager level and at the total portfolio level – Market Indices, Peer Groups, and Absolute Return Indices. The use of benchmarks as reference points helps you assess precisely ‘how you’re doing’ versus the market, versus your peers, and versus your goals. And they support you in your obligation to monitor and evaluate performance. At the manager level, benchmarks serve as standards for measuring the value generated by active money managers. At the total portfolio level, they allow fiduciaries to understand how your investment program is doing relative to the established goals and mission of the organization and to help determine if you’re making good decisions. Investment committees may meet as often as quarterly to review portfolio and performance results. Given this frequency, it’s easy to focus in on short-term periods of relative performance versus a benchmark—a tendency which may lead to poor decision making. By nature, institutions generally have a long-term time horizon, often in perpetuity, which aligns with a longer-term performance evaluation period. So, decisions should be made based on a full market cycle of 5 years or more.
Asset class benchmarks and market indices
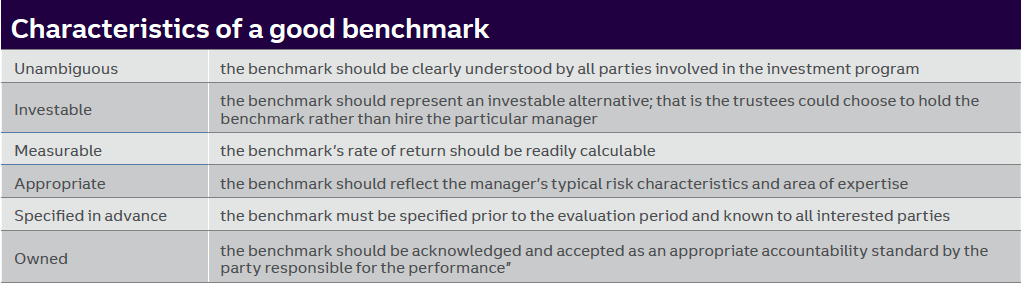
Traditional asset classes commonly use market indices as benchmarks. A market index is a reference portfolio of securities that’s used to measure the value of a particular market. There are a wide variety of indices available to track equity and fixed income asset classes across market capitalizations, styles and sectors. As performance evaluation benchmarks, market indices are ideal because data is widely available and relatively easy to understand—despite the fact that there are dozens of indices that can be used to evaluate the performance of any given investment. Common index providers include MSCI, known for global equity markets; Russell, known for U.S. equity market and style sub-sets; and Bloomberg Barclays, covering fixed income sectors, among many others. Each of these providers has its own index construction methodology. Often, equity indices are constructed by a capitalization-weighted method (where the largest market cap company in an index comprises the largest weight of the index). Therefore, a large price move in the largest company in an index can have a dramatic effect on the index’s value on any given day. In contrast to traditional asset classes where there’s a broad array of investable market indices to choose from, benchmarking in the alternative investments space is much different. There are no market indices to track these strategies; thus, peer universes are used to construct benchmarks such as HFRI (Hedge Fund Research Indices) that reflect hedge fund managers in the HFR database. However, since many diversified hedge fund investments offer differing investment strategies, it can be challenging to identify an appropriate peer group that represents a specific strategy. In addition, hedge fund benchmarks are not investable and suffer from survivor bias as described below. All of these factors present challenges in selecting benchmarks for alternative strategies. According to the Research Foundation of CFA Institute, “the most informative assessment of investment performance occurs when the benchmark has certain basic properties” (see Characteristics of a good benchmark below):
Peer groups
At the manager level, peer universes reflect investment managers with similar investment objectives. These are useful when evaluating the relative merits of an active management strategy, providing another layer of context to index comparisons. Investors often try to gauge a manager’s skill by comparing their performance to that of a group of similar managers. Common manager peer universes include eVestment Alliance, Morningstar, and Lipper. Each has its own construction methodologies.
In evaluating total portfolio performance versus peer groups, there are many sub-sets of institutional peer groups available—community foundations, private foundations, charitable organizations, and endowments, to name just a few. These organizations often use peer group analysis to learn how the investment portfolios of similar organizations are performing and what they may be doing differently. This information may help improve investment outcomes and demonstrate to potential donors that you are prudent stewards of assets.
Many charitable organizations refer to the NACUBO Study of Endowments for peer universe data because of the detailed level of reporting it provides on asset allocation and investment performance. The data is widely publicized and is comprised of a large number of the nation’s endowments for institutions of higher learning (705 for FYE 2020) reporting return and asset allocation data segmented by asset size. Returns are also broken out by asset class and market size for more detailed comparisons.
While NACUBO may be a very relevant peer group for educational endowments, other types of non-profit organizations should keep in mind that these endowments have the ability to raise additional funds to meet their obligations during times of market drawdowns and liquidity constraints. Many of the largest endowments that report to NACUBO have a solid base of potential donors they can rely on for financial support during difficult times. Other non-profits such as private foundations and some types of charitable organizations may not be able to raise additional assets therefore unable to fulfill their obligations. With peer groups, it’s important to understand an individual organization’s unique goals and needs, and then select a peer group that’s most similar.
While peer universes are of interest, they don’t possess some of the qualities that make a good benchmark (as defined in Characteristics of a Good Benchmark table on page 2). They’re not investable and they’re not specified in advance. Fiduciaries need to understand that ‘survivor bias’ is an important drawback to peer groups. This occurs when poor performing constituents drop out of a peer universe and their performance is no longer represented. It causes an upward bias and overestimation of the average performance of the universe. At the individual manager level, it’s common for poor performing mutual funds to be merged with a more successful one, thus skewing up the returns of the peer group.
Total portfolio benchmarking
Total portfolio benchmarks assist in understanding performance in relation to the established goals and mission of the organization—as stated in your investment policy statement (IPS). They help to answer important questions such as: Are we making good decisions? Where should we be spending more time? How do we compare to our peers?
Perhaps the most relevant total portfolio benchmark is a goals-based benchmark that reflects the absolute return target for the organization. This is the return objective that’s needed to sustain the organization’s mission going forward. It should be a primary consideration for fiduciaries as it measures whether the organization has been able to sustain its charitable purpose. It focuses on supporting the mission, while preserving the real value of the portfolio net of inflation.
Investment Return Objective =
Distribution/Payout + Fees + Inflation
Example: Net (of fees) investment Return = CPI + 5%
An absolute return benchmark provides a way to measure your organization’s spending goals versus portfolio performance. If the long-term goals of the organization are not being met, relative portfolio performance versus a market benchmark becomes less relevant. Organizations with a distribution/payout-based objective might consider using absolute return benchmarks to focus the evaluation on whether the long-term goals and mission of the organization are being met. It’s important to keep in mind that an absolute return benchmark is mission-based and doesn’t reflect how the overall market has performed. Thus, it’s not a relevant benchmark for manager evaluation.
Consider a simple 70% S&P 500® and 30% Bloomberg Barclays Aggregate relative benchmark that has underperformed an absolute return policy benchmark of CPI + 5% over shorter time periods. There may be periods when an absolute return benchmark is difficult to achieve; thus, a long-term focus is necessary.
Constructing a policy benchmark for a diversified portfolio
At the total portfolio level, market benchmarks are passive representations of the investment process showing the risk and return expectations of the institution. When benchmarking against the market, it may be useful to use a simple market benchmark as well as a blended benchmark that comprises the asset classes represented in the portfolio. This allows for evaluation of how the broad market has performed (simple benchmark) as well as how the active management and tactical positioning of the portfolio (blended benchmark) affected its returns over a given time period.

Market benchmarks allow fiduciaries to evaluate how an investment program is doing relative to the overall market and judge how an external investment advisor or consultant’s recommendations are adding value. A simple market benchmark denotes the overall investment objective of the portfolio and is sometimes referred to as a ‘naïve benchmark.’ For a portfolio that’s comprised of roughly 70% equities and 30% fixed income, the benchmark may be 70% S&P 500 and 30% Bloomberg Barclays Aggregate. For a global portfolio, a more appropriate benchmark may be 70% MSCI ACWI and 30% Bloomberg Barclays Aggregate.
Alternatively, a more complex policy benchmark blends the strategic asset allocation targets from the IPS and includes the asset classes comprised in the portfolio. This is sometimes referred to as the policy portfolio. It provides the framework for measuring results relative to the risk-adjusted return objectives stated within the IPS. A well-diversified investment portfolio should meet your long-term risk/return objectives and is the result of asset allocation analysis which incorporates long-term strategic targets for each asset class based on capital market assumptions. Forward-looking capital market assumptions include expected risk and return, as well as correlation, and are integral to properly diversifying a portfolio to achieve maximum return given an acceptable level of risk. Once the strategic asset allocation targets are set, a policy benchmark can be created and incorporated into the IPS that blends the relevant indices with the strategic targets for each asset class.
The use of a properly constructed and clearly defined policy benchmark will allow you to view investment performance results in the correct, relative context and measure progress accordingly.
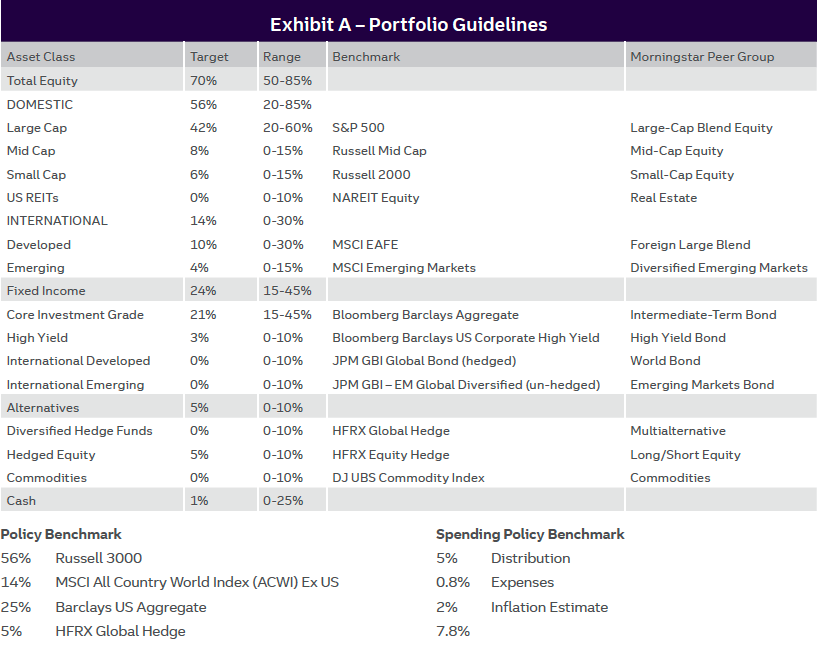
The following sample (Exhibit A – Portfolio Guidelines) illustrates how benchmarks can be incorporated into your IPS. The stated policy benchmark blends the broad asset class targets and their appropriate indices. This policy benchmark can be constructed to be more granular (if desired) and include sub-asset classes, such as high yield fixed income. In addition, the spending policy benchmark is included to represent the absolute return investment objective of a non-profit organization with a 5% spending policy. Finally, indices and peer groups are specified at the asset class level for performance measurement at the underlying manager level. You should consult your investment advisor to help construct a customized benchmark most appropriate for your investment program.
Conclusion
Benchmarks are a valuable tool in the performance evaluation process. To assist you in fulfilling your fiduciary obligation to monitor and evaluate performance, you should focus on measuring what matters:
- Establish and monitor relevant benchmarks to understand the trend of performance and how the portfolio is tracking to long-term targets.
- Don’t overemphasize the most recent monthly or quarterly data. Instead focus on a full market cycle of 5 years or more.
- Consider an absolute return policy benchmark, knowing that it may require a long market cycle to achieve.
- Consult peer group comparisons for greater perspective.
Measuring what matters and using a combination of benchmarks will likely give you the broadest and clearest perspective to answer the important question of “How are we doing?
About Truist Foundations and Endowments Specialty Practice
Truist has more than a century of experience working with not-for-profit organizations. Fiduciary stewardship is the heart of our culture. We’re not just a provider, but an invested partner—sharing responsibility for prudent management of not-for-profit assets. Our client commitment, not-for-profit experience, and fiduciary culture are significant advantages for our clients and set us apart. The Foundations and Endowments Specialty Practice works exclusively with not-for- profit organizations. Our institutional teams include professionals with extensive not-for-profit expertise. These professionals are actively engaged in the not-for profit community and are able to share best practices that are meaningful to their clients. Team members offer guidance and advice tailored to the various subsets of the not-for-profit community, including trade associations and membership organizations. Our Practice delivers comprehensive investment advisory, administration, planned giving, custody, trust and fiduciary services to trade associations, educational institutions, foundations, endowments and other not-for profit clients across the country.
Interested in having a deeper conversation about performance benchmarking?
Contact your Truist relationship manager or investment advisor or call us at 866-223-1499.